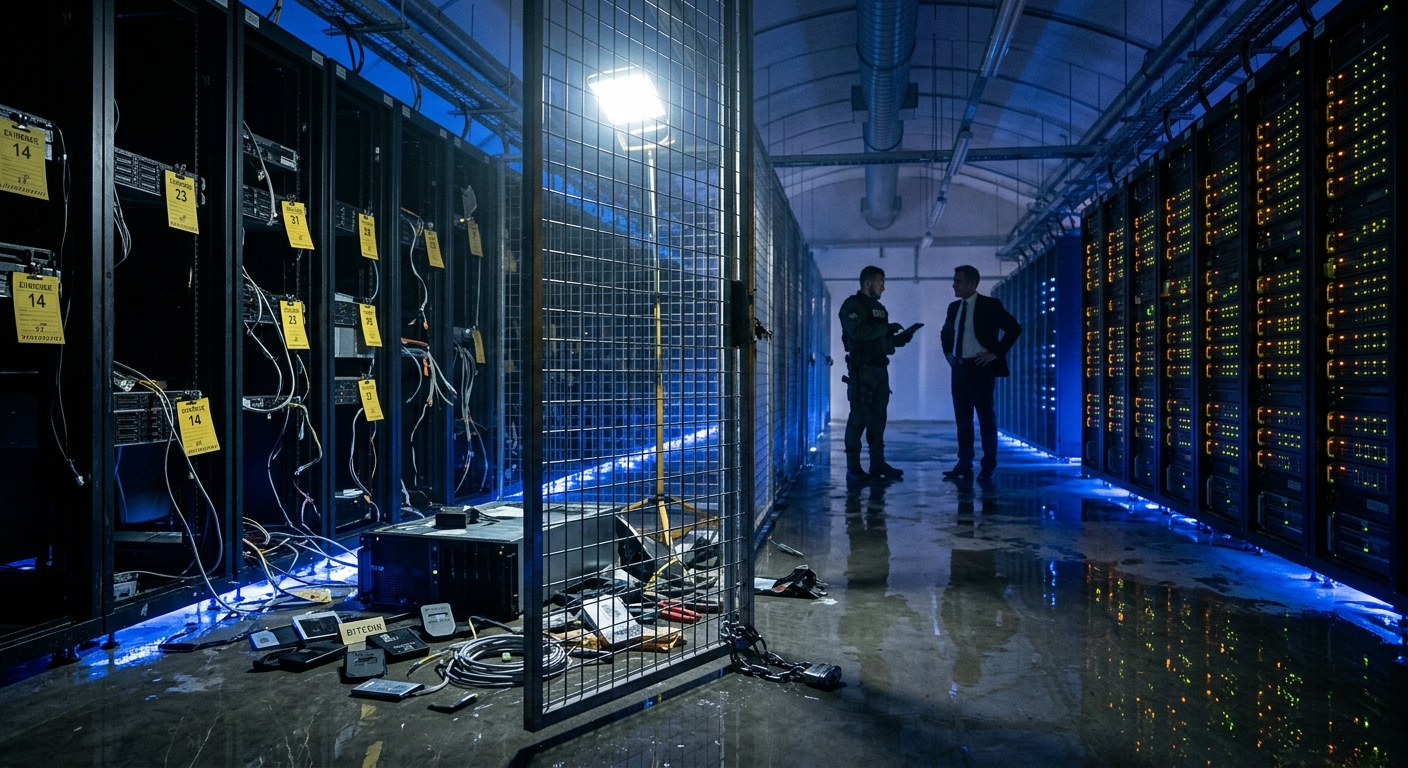
This is the first of a three-part mid-year accounting for 2026. Part one covers ransomware; part two covers healthcare; part three covers what law enforcement did about it. Our narrative mid-year breach review published in July covered the individual incidents that defined the half. This series covers the numbers underneath them.
The Headline Figures
4,217 ransomware attacks were logged in the first six months of 2026 — an average of 23 per day, and an 11% increase over the 3,809 recorded in the second half of 2025, per Comparitech’s H1 roundup.
That growth rate is the least interesting number in the set. What matters is the split:
- 484 attacks confirmed by the targeted organization
- 3,733 attacks claimed by a ransomware group but never publicly acknowledged by the victim
- 5,019,204 records compromised in the confirmed attacks alone
Eleven percent of ransomware attacks in the first half of 2026 were ever admitted to by the company they happened to. The five million records above come from that eleven percent. The real figure is not knowable, and the gap between what is claimed and what is confirmed is where every reliable ransomware statistic goes to die.
Black Kite’s separate tally, measured on a different window, tracked ransomware disclosures rising from 6,046 to 7,551 — a 24.9% increase and the fourth consecutive year setting a new high.
The Ecosystem Grew Faster Than the Victim Count
The number of active ransomware groups reached 146 by June 2026, up from 127 at the close of the prior reporting period. Black Kite counted 61 new groups entering the market between April 2025 and March 2026 — more than one new brand per week, sustained for a year.
This is the structural story of 2026 and it is frequently misread as chaos. It is the opposite. Group proliferation is what a healthy franchise market looks like after its largest brands are disrupted. LockBit’s dismantling did not remove capability from the ecosystem; it distributed capability across more brands with lower name recognition and no reputational overhead. The affiliates did not retire. They rebranded.
The practical consequence for defenders is that threat-actor-specific detection is worth less every quarter. A playbook keyed to the top five groups covered a majority of activity in 2022. Against 146 groups sharing overlapping affiliates, tooling and initial-access brokers, it covers a fraction.
The Leaderboard
| Group | H1 2026 victims | Confirmed |
|---|---|---|
| Qilin | 641 | 54 |
| The Gentlemen | 464 | 51 |
| Akira | 317 | — |
Qilin took the half. It has held the top position for most of the last eighteen months, and its exploitation of a Check Point VPN zero-day in June — which drew a CISA emergency directive — showed a group operating well above affiliate-tier capability.
The Gentlemen is the more significant entry. In June 2026 it knocked Qilin off the top spot for the first time in many months, posting 115 victims to Qilin’s 78. That was not a fluke month for a group that has been climbing all year: Check Point’s leak of its backend in May exposed the operation’s internals, Krebs attributed it in June, and it kept running — through dental and spinal practices in Texas and, this month, a 6TB theft from AnMed accompanied by the hijacking of the health system’s Facebook page.
Public exposure of a ransomware operation’s infrastructure and the identification of its operator, in the same quarter, slowed it down not at all.
Who Got Hit
| Sector | Attacks | Change |
|---|---|---|
| Manufacturing | 822 | ↑10% |
| Service-based | 609 | — |
| Retail | 326 | ↑28% |
| Technology | 323 | ↑23% |
| Finance | 257 | — |
Manufacturing remains the single most-attacked sector, and has been for years, for reasons that have nothing to do with data value. Manufacturers run flat networks, legacy OT, and production lines where an hour of downtime has a defensible dollar figure attached. That last property is what makes them pay.
The 28% jump in retail and 23% in technology are the movements worth tracking into H2.
Geographically, the United States absorbed 1,832 attacks — 43% of the global total, but down 8% from H2 2025. The decline is real and unexplained; it may reflect displacement toward softer jurisdictions rather than improved American defense. Italy rose 66% to 131 attacks. China rose 540%, from 5 attacks to 30 — a small absolute number, but a category that barely existed before.
What Victims Actually Paid
- Median ransom demand: $150,000
- Average ransom demand: $1.36 million
- Largest demand: $100 million — NetRunner, against a Japanese hospital
- Organizations that publicly confirmed paying: two
The two were Instructure — whose breach we covered in the Canvas LMS supply chain failure — and the law firm Weil, Gotshal & Manges, reported at up to $20 million.
Two confirmed payments against 4,217 attacks does not mean nobody paid. It means disclosure of payment carries legal, regulatory and reputational costs that virtually every organization declines to absorb. The gap between the median demand of $150,000 and the average of $1.36 million tells the more useful story: the distribution is dominated by a long tail of small demands against small organizations, with a handful of very large asks against targets that can plausibly pay them. Most ransomware is a volume business.
What Carries Into H2
Three things from this half are already shaping the second:
The Gentlemen’s June is not a blip. A group that overtakes Qilin after having its backend leaked and its operator named is demonstrating that exposure no longer imposes cost. Expect the top of the leaderboard to keep turning over.
Confirmation rates will not improve. Eleven percent is a reporting artifact of jurisdictions where disclosure is optional. Nothing in the 2026 regulatory calendar changes that.
Group count matters more than group identity. At 146 active operations and one new entrant a week, defense keyed to actor attribution is defense with an expiring shelf life. What holds is defense keyed to the initial-access techniques they share — which is where part three of this series, on the takedowns, ends up mattering more than the leak-site scoreboard.